

We Build Your Website And the System Behind It
WebCorp Systems designs high-converting websites, redesigns underperforming ones, and builds CRM & automation systems for growing businesses. You worked hard to build a great business — we'll build a website that reflects it.
Services: Website Design · Website Redesign · CRM Systems · Marketing Automation · Analytics
Our Services
Everything you need to capture and convert leads. From first impression to closed deal — we build the complete digital infrastructure that makes it happen.
High-performance websites that establish credibility and convert visitors into customers. Mobile-first, fast-loading, and built to impress. Features include modern, polished design, mobile-friendly on all devices, SEO-optimized for Google, and fast load times.
Already have a website that's not performing? We'll redesign and rebuild it into a modern, high-converting asset — without starting from scratch. Includes full visual overhaul, improved UX & navigation, performance optimization, and content migration.
Never miss a lead again. We set up complete CRM systems that capture, organize, and nurture your prospects automatically. Features include pipeline management, contact organization, lead scoring, and team collaboration.
Automated follow-ups, email sequences, and workflows that work 24/7 — so you can focus on closing deals, not chasing them. Includes email sequences, SMS campaigns, automated follow-ups, and booking integrations.
Know exactly what's working. Custom dashboards and tracking that give you clear visibility into your marketing ROI. Includes custom dashboards, conversion tracking, ROI attribution, and performance reports.
Our Track Record
50+ Projects Shipped · 3+ Years in Business · 98% Client Satisfaction · 24hr Avg Response Time
Recent Projects
Avella Booking
Industry: AI Booking. Complete digital transformation for an AI-powered booking platform. Built a high-converting website with integrated scheduling and automation. Deliverables: Website, CRM, Automations. Visit Avella Booking
Priority Consulting
Industry: Professional Services. Modern website and client management system for a consulting firm. Streamlined lead capture and proposal generation. Deliverables: Website.
Industry: Professional Services. Modern website and client management system for a consulting firm. Streamlined lead capture and proposal generation. Deliverables: Website. Visit Priority Consulting
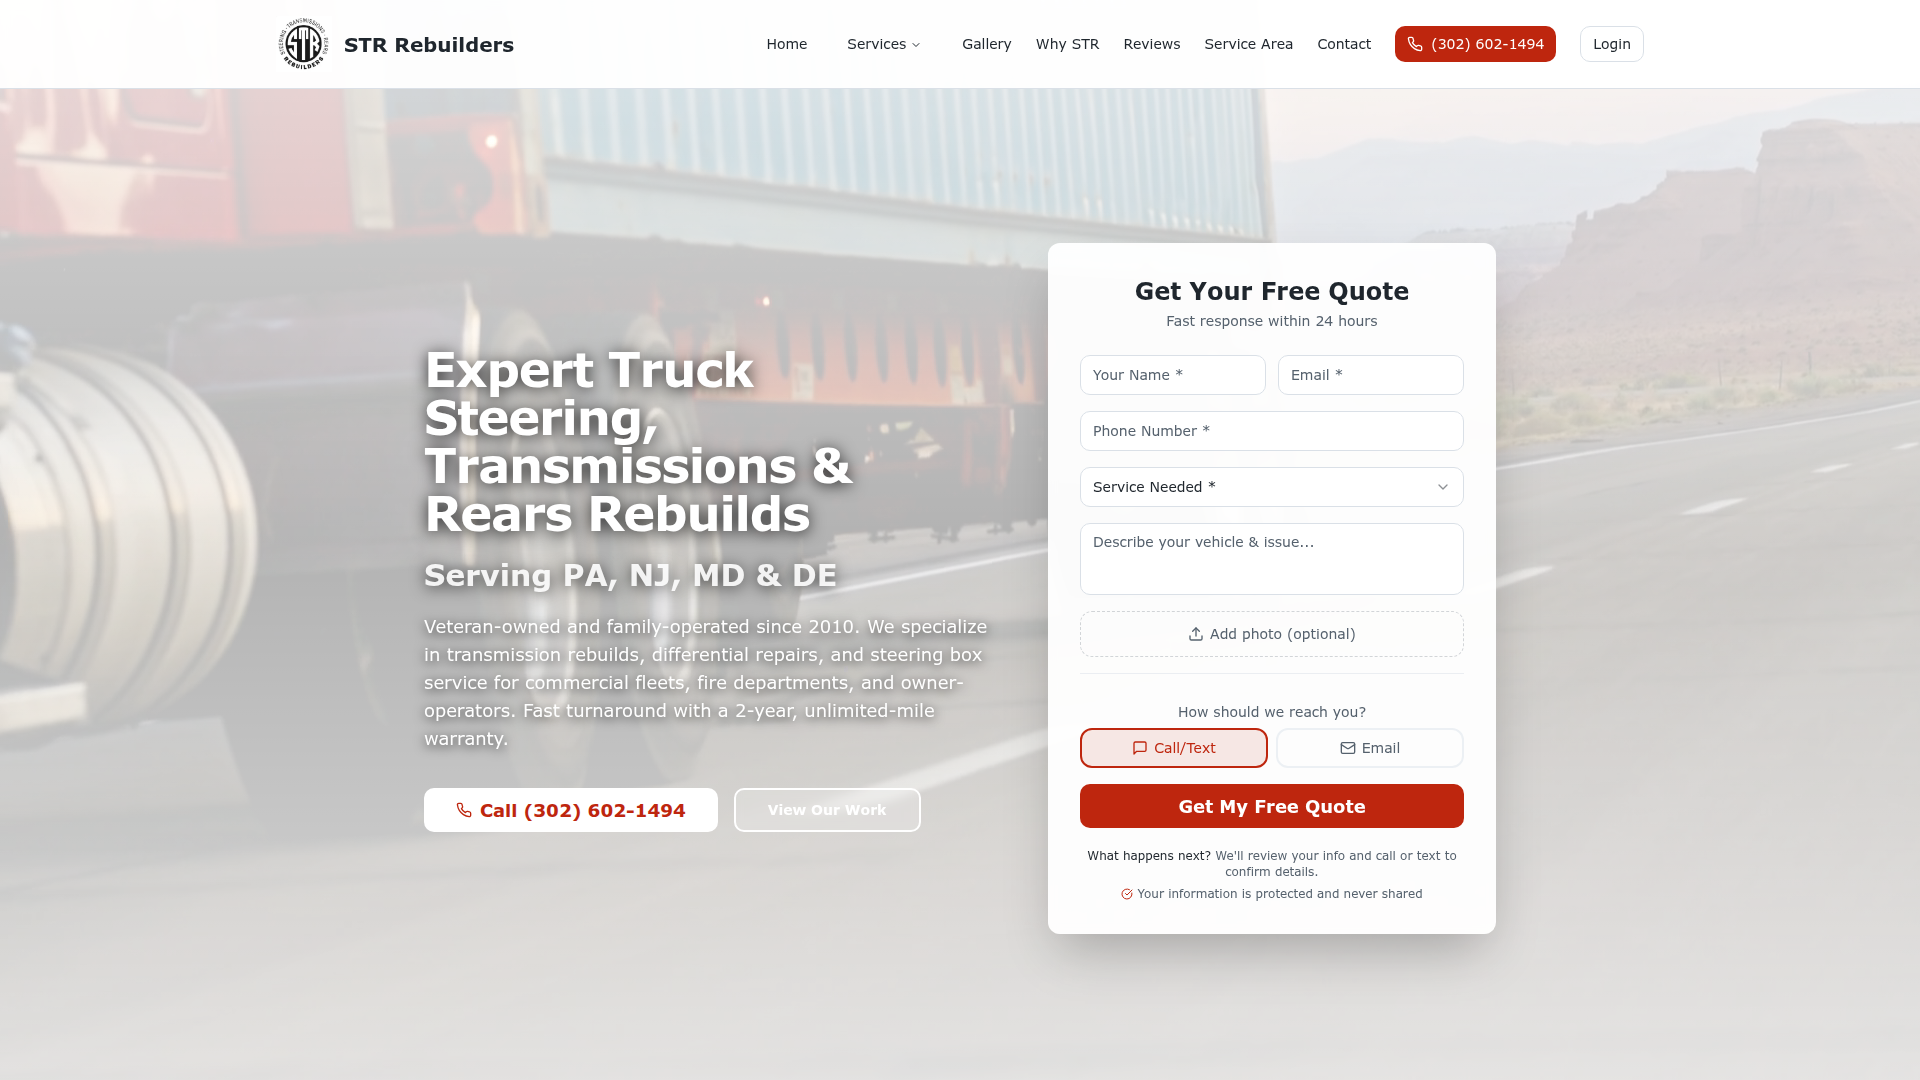
STR Rebuilders
Industry: Truck Repair. Lead capture and automated follow-up system for a professional truck repair shop. Increased conversion rate by 40%. Deliverables: Website, CRM, Automations. Visit STR Rebuilders
Investment Tiers
Transparent scope. Custom pricing based on your specific requirements.
Starter Website — Starting at $5k
A fast, conversion-focused website to establish your online presence. Timeline: 2-3 weeks. Includes: 5-7 page website, mobile-responsive design, on-page SEO setup, contact form integration, Google Analytics, and 30-day support.
Website + CRM — Starting at $12k (Most Popular)
Website plus a complete lead management system. Timeline: 4-5 weeks. Includes everything in Starter plus: CRM pipeline setup, lead capture forms, contact management, basic email sequences, team training session, and 60-day support.
Full Growth System — Starting at $25k
The complete infrastructure for predictable, scalable growth. Timeline: 6-8 weeks. Includes everything in Website + CRM plus: advanced automations, SMS integration, calendar booking, custom dashboards, multi-user access, quarterly strategy calls, and priority support.
All pricing is project-based. We'll provide a detailed proposal after our initial call.
Frequently Asked Questions
How long does a typical project take?
Timelines vary based on scope. A standalone website typically takes 2-3 weeks. Website + CRM projects run 4-5 weeks. Full growth system implementations take 6-8 weeks. We'll provide a detailed timeline during our initial call.
Do I own everything you build?
Yes. You own 100% of the website code, CRM data, automations, and all assets we create. We don't hold anything hostage. If you ever want to move, everything is yours.
What kind of support is included?
All projects include a support period (30-90 days depending on tier) for bug fixes and minor adjustments. After that, we offer ongoing support retainers for clients who want continued optimization and priority access.
How many revisions are included?
We include two rounds of revisions at each major milestone. Our collaborative process means most feedback is addressed in real-time during weekly demos, so you're never surprised at the end.
Can you set up analytics and tracking?
Absolutely. We set up Google Analytics, conversion tracking, and custom dashboards so you can see exactly what's working. For full system clients, we build end-to-end attribution.
Do you integrate with my existing tools?
Yes. We regularly integrate with tools like Zapier, Make, Calendly, Stripe, QuickBooks, and most major marketing platforms. During discovery, we'll map out all your integration needs.
Ready to Transform Your Digital Presence?
Let's discuss how we can build the digital infrastructure your business needs to scale. No pressure, just a conversation about your goals.
Custom Website Design That Turns Visitors Into Customers. Your website should be your hardest-working salesperson. We build high-performance, mobile-first websites that establish credibility and drive conversions — not just look pretty.
Why Most Business Websites Fail
First impressions happen in 0.05 seconds — outdated design kills trust. 53% of mobile users leave if a site takes longer than 3 seconds to load. 88% of consumers won't return after a bad user experience.
What Makes Our Websites Different
Modern, conversion-focused design with strategic layouts and proven conversion principles. Mobile-first architecture — 70%+ of traffic comes from phones. Built for speed — optimized for under 2-second load times. SEO foundation with proper heading structure, meta tags, and schema markup. Lead capture systems with strategic form placement and chat widgets.
Website Design Investment
Starting at $5,000. Projects typically include 5-7 pages and are completed in 2-3 weeks. Includes custom page designs, mobile-responsive layout, contact form integration, Google Analytics setup, on-page SEO, and 30-day support.
Website Design FAQ
How long does a website project take? Most websites are completed in 2-3 weeks. Complex sites may take 4-5 weeks.
Do I own the website? Yes. You own 100% of the design, code, and content. No ongoing licensing fees.
Will my website work on mobile? Absolutely. Mobile-responsive design is standard on every project.
Related: Website Redesign · CRM & Lead Management · Analytics
Website Redesign That Preserves Your SEO & Transforms Your Results. Don't throw away years of SEO history and domain authority. We redesign and rebuild existing websites into modern, high-converting assets — while keeping everything Google values.
Is Your Website Hurting Your Business?
You're embarrassed to send people to your site. Mobile traffic bounces immediately. Competitors with newer sites are ranking above you. Lead forms don't work or go to an old email nobody checks. You're losing sales to businesses with more professional online presence.
Redesign, Don't Rebuild From Zero
Keep your SEO history — domain authority, existing rankings, and inbound links preserved. Complete visual overhaul with modern aesthetics and mobile-responsive layout. Performance boost — typically 50-80% faster load times. Content strategy update with refreshed messaging that converts.
Website Redesign Investment
Starting at $7,000. Redesigns typically take 3-4 weeks and include complete visual overhaul, UX improvements, content migration, SEO preservation, 301 redirect mapping, and 60-day support.
Website Redesign FAQ
Will I lose my Google rankings? Not if done correctly. We use 301 redirects and preserve content structure. We've redesigned 50+ sites without SEO loss.
How long will my site be down? Typically under 1 hour, often minutes. We build on staging and coordinate the switch.
Do you migrate all my content? Yes. Text, images, PDFs — all migrated and preserved with proper redirects.
Related: CRM Integration · Marketing Automation · Analytics Setup
CRM Systems for Growing Businesses. Stop losing leads in spreadsheets and forgotten emails. We build complete CRM systems that capture, organize, and nurture every prospect automatically — so you close more deals with less chaos.
The Hidden Cost of Poor Lead Management
79% of marketing leads never convert — poor follow-up is the #1 reason. 35-50% of sales go to the vendor who responds first. Leads scattered across email, forms, texts, and voicemails. No system for tracking which leads are hot vs. cold.
A CRM System That Actually Works
Automatic lead capture — every lead flows into one central system. Visual pipeline — drag-and-drop leads through stages. Smart organization with tagging, scoring, and filtering. Automated follow-ups — set it once, run forever. Team collaboration with full activity history. Never miss a lead with instant notifications.
CRM Setup Investment
Starting at $3,500 (bundled with website) or $6,000 standalone. Includes platform configuration, automation setup, team training, and 60-day support. Monthly software costs: $45-$300/month.
CRM FAQ
How long does CRM setup take? Most implementations are complete in 3-4 weeks. Complex setups may take 5-6 weeks.
Can you migrate our existing data? Yes. We handle migration from spreadsheets, old CRMs, or any database. We clean and deduplicate during the process.
Is our data secure? All recommended platforms are enterprise-grade with bank-level security and compliance certifications (SOC 2, GDPR).
Related: Marketing Automation · Website Integration · Analytics Dashboards
Marketing Automation That Nurtures Leads While You Sleep. Set up automated email sequences, SMS campaigns, and follow-up workflows that work 24/7. Focus on closing deals, not chasing prospects.
Why Manual Follow-Up Is Killing Your Conversion Rate
80% of sales require 5+ follow-up attempts. But 44% of salespeople give up after one. Leads contacted within 5 minutes are 21x more likely to convert. You're manually sending the same email over and over and losing leads who need weeks of nurturing.
Automated Workflows That Never Miss a Beat
Email sequences that send automatically based on triggers. SMS campaigns with 98% open rates. Behavior-based triggers — actions trigger next steps. Lead scoring to prioritize hot leads. Appointment booking with automated reminders. Re-engagement campaigns for win-back sequences.
Marketing Automation Investment
Starting at $4,000 (bundled with CRM) or $7,000 standalone. Includes automation strategy, up to 5 email/SMS sequences, workflow configuration, CRM integration, template design, and 60-day support. Monthly platform costs: $20-$400/month.
Marketing Automation FAQ
Do you write the emails? We provide proven templates you can customize, or write custom content for an additional fee.
Can we send SMS without annoying people? Yes, following TCPA compliance. We only text opted-in contacts and make it easy to opt out.
Can we edit automations after you build them? Absolutely. We train you to edit, clone, and create new automations.
Related: CRM Setup · Analytics Dashboards · Website Integration
Stop Guessing What's Working. Get complete visibility into your marketing ROI with custom dashboards that show exactly where your revenue comes from.
Flying Blind Is Expensive
Which lead source has the highest close rate? What's your true cost per customer? Where do leads drop off in your funnel? Google Analytics is installed but you never look at it. Data is spread across 5 different platforms.
One Dashboard. Complete Visibility.
Custom dashboards — website traffic, lead flow, pipeline value, conversion rates, and revenue in real-time. Conversion tracking for every form fill, phone call, and booking. ROI attribution connecting marketing spend to revenue. Automated reporting delivered weekly or monthly. Goal tracking and real-time alerts.
Analytics Setup Investment
Starting at $2,500 (bundled with website or CRM) or $4,000 standalone. Includes analytics audit, tracking code installation, conversion event setup, custom dashboard creation, data integration, automated reporting, and 90-day support. Most analytics tools are free (Google Analytics, Looker Studio).
Analytics FAQ
Do I need to know anything technical? No. Dashboards are visual and easy to understand. If you can read a chart, you can use it.
How long does setup take? Most analytics projects are complete in 2-3 weeks. Complex integrations may take 3-4 weeks.
Will I get automated reports? Yes. We set up automated email reports on your preferred schedule (weekly, monthly).
Related: Website Optimization · CRM Integration · Marketing Automation
Get in Touch
WebCorp Systems — We build high-converting websites and automated CRM systems for growing businesses. From first impression to closed deal.
Email: hello@webcorpsystems.com · Mon – Fri, 9am – 6pm EST
© 2025 WebCorp Systems. All rights reserved.